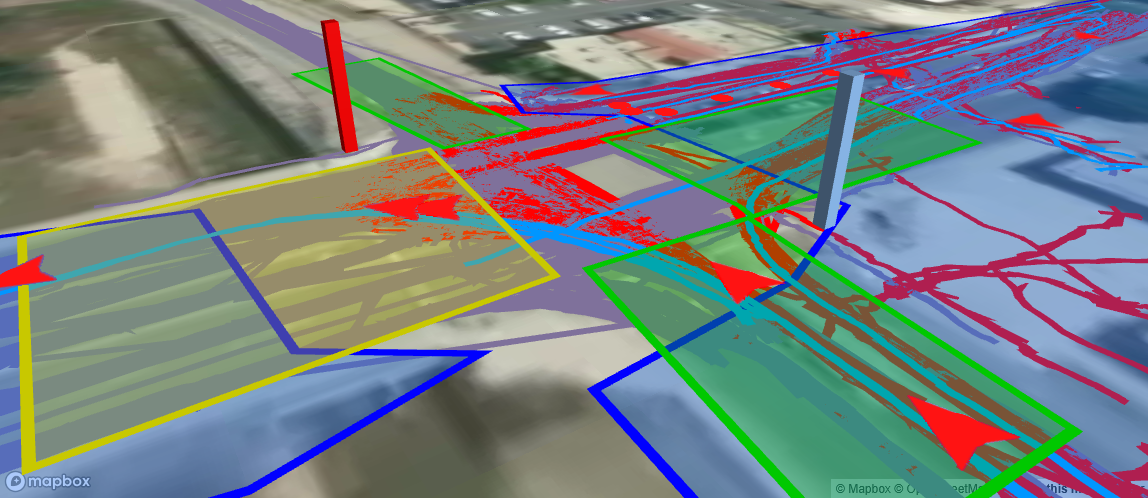
Metadata Collection Interface
Date of Project Completion: 2026-8-21
Tags: Software Engineering, MongoDB, NodeJS, React
Originally developed to remove third-party dependencies, the codebase I developed collects live data from CCTV cameras located across the district. This data is parsed and stored in a MongoDB database, which can then be accessed through a React dashboard to display time series graphs of vehicle traffic based on movement and object type, live maps of the locations and the detected objects in real time, and heatmaps of the locations based on traffic flow. The system was capable of collecting data from two cameras at the same intersection, and combining their data to get a complete record of traffic behavior. This technology is being implemented across the district, with the intention to use this data to make safer intersections for all.
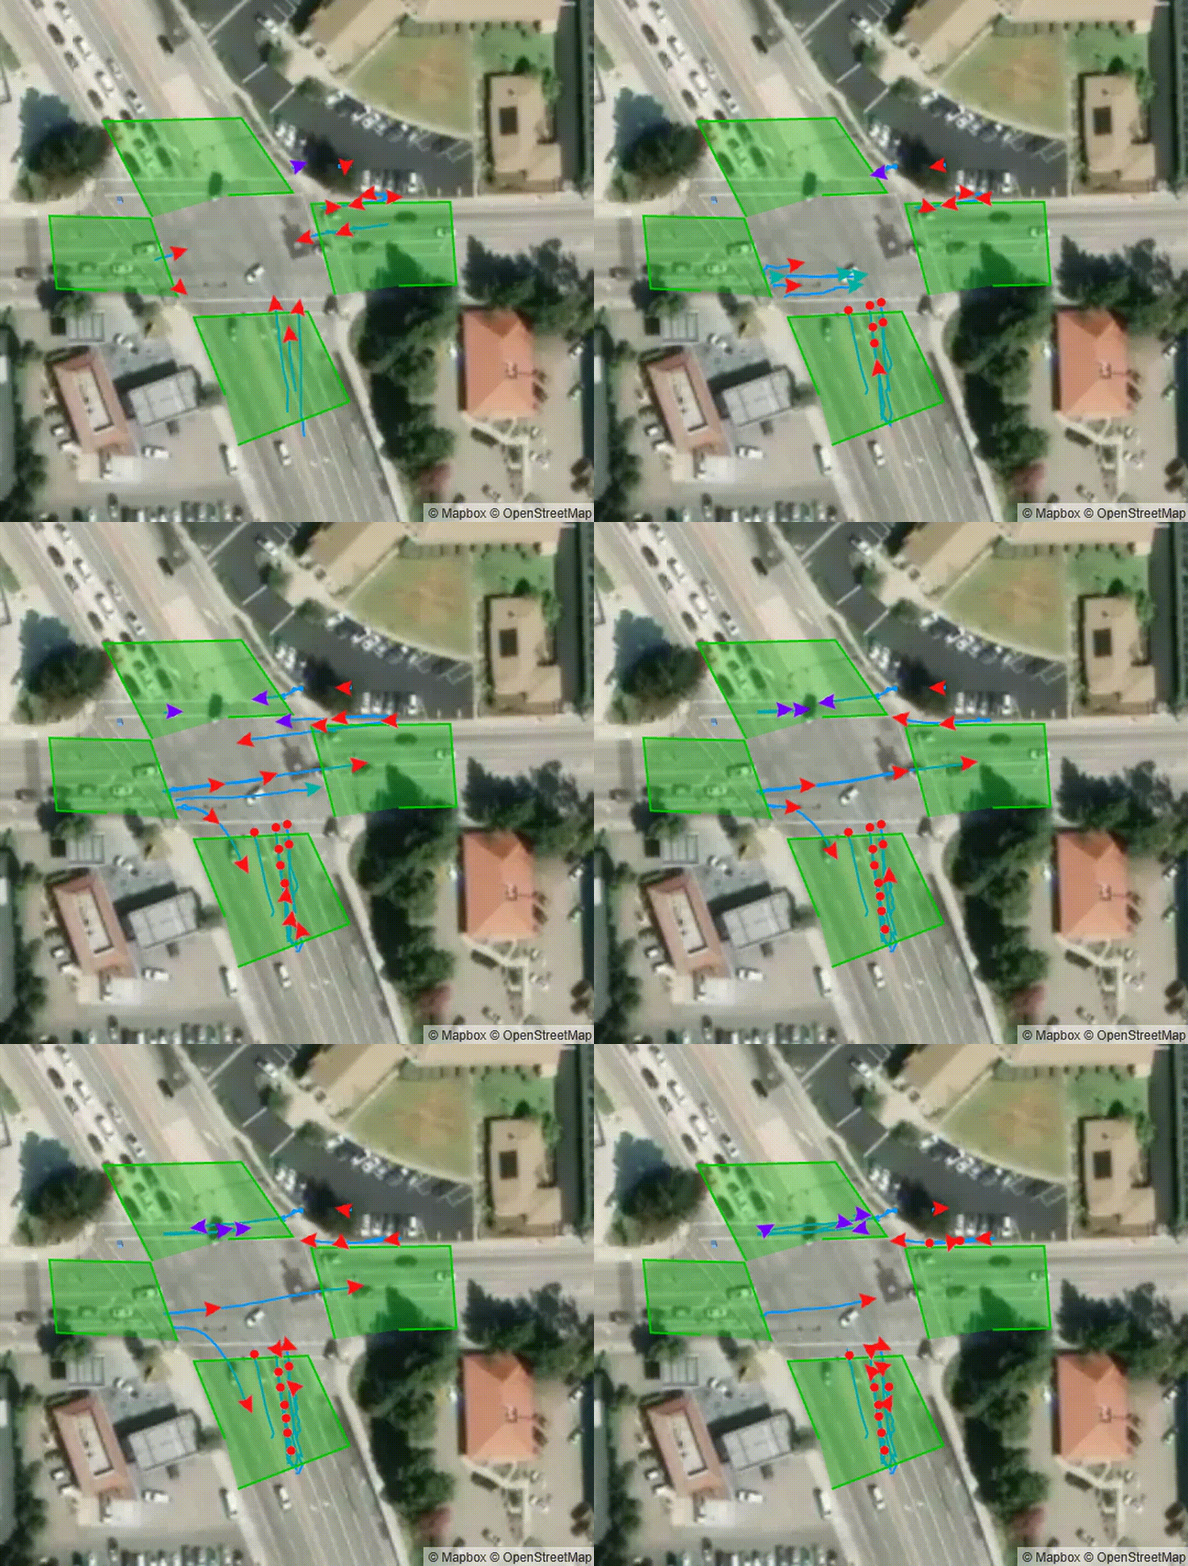
Example Output of Live Map of Detected Objects.
Data Collection
The metadata parser connects to each camera via an RTSP tunnel through ffmpeg, where a metadata channel can usually be found alongside the video stream. I was able to locate these by analyzing the web interface, specifically the websockets that are initialized when the site loads.
The XML collected is then constantly parsed using fast-xml-parser, which separates each frame of metadata into a collection of Objects. Each camera keeps a list of objects recently detected, where the new data is appended. After an object has not been detected for a long time, the object is sent to the local database.
This allows data that is broadcasted from the camera to be stored on local servers, removing any dependency on paying for access to the data stored on vendor servers.
Graphs
Collecting the data into a custom database is great, but it won't be useful unless it can be accessed or visualized in an effective way. My next step was to develop an application to monitor the program and access data.
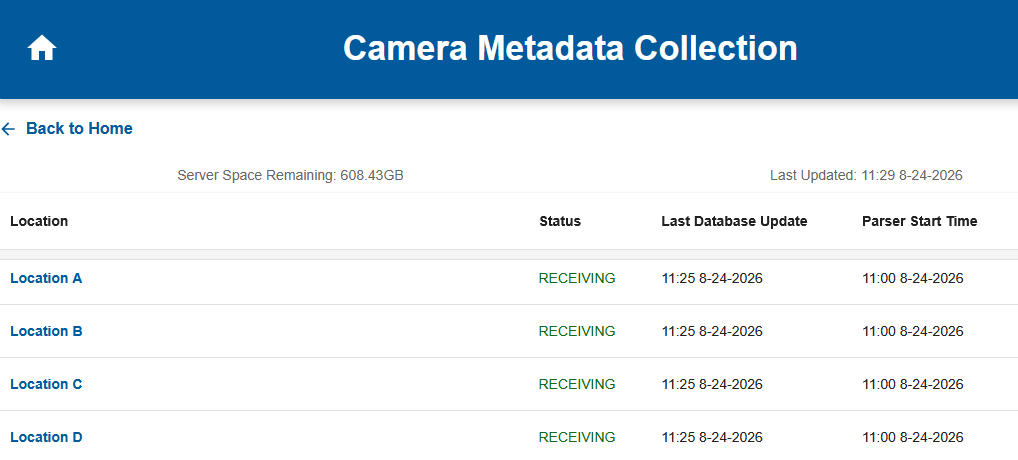
The homepage displaying the status of each location.
Developed using the MERN Stack, the application allows multiple methods of accessing data in a way that is both visually understandable and easy to export to other programs.
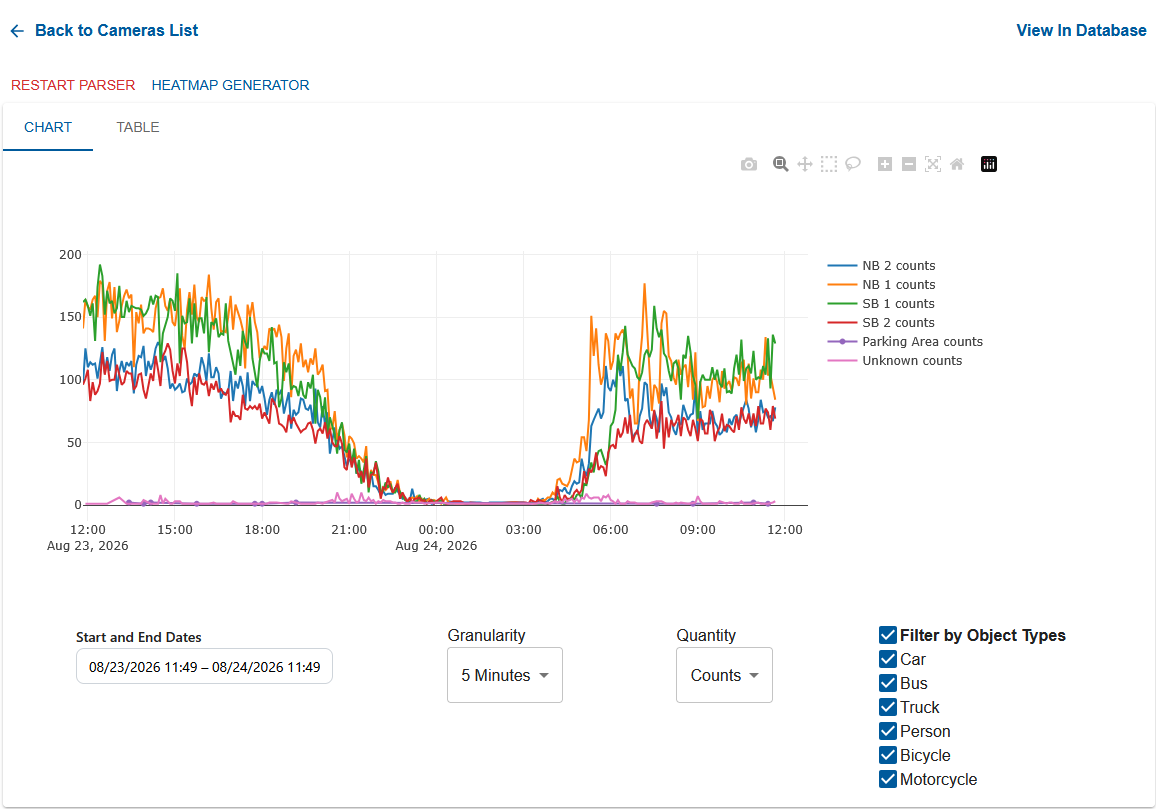
Time-series plot of quantities aggregated into five-minute bins.
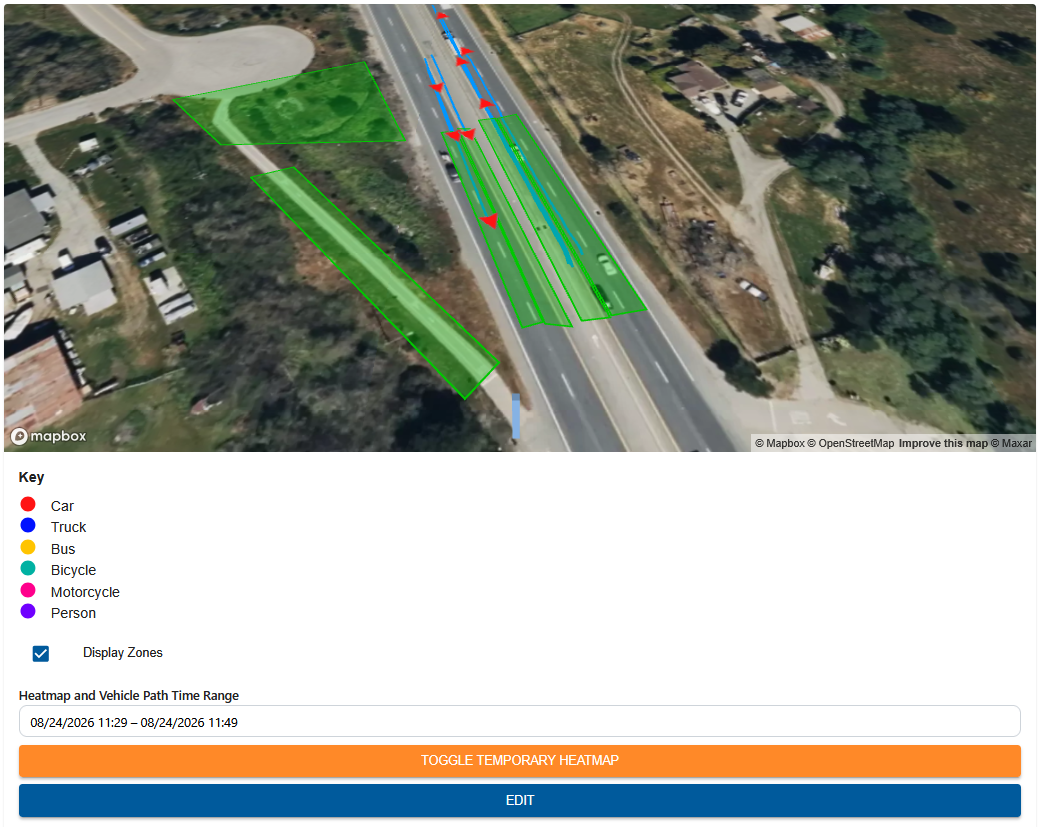
Live map of detected objects and zone overlays.
Multi-Camera Collection
All of this is interesting, but not necessarily new. What I've yet to find any research on is the combination of this anonymous data from various sources to create a complete representation of intersection behavior. Could we put a second camera, facing in the opposite direction, to observe the entire intersection, understanding turning movement as well?
I felt that there were two possible ways for this to be implemented:
- Synchronizing the frames of data, combining them, and using attributes like position, velocity, and direction to combine objects that were believed to be the same thing.
- Only focusing on specific behaviors/for each view(eg, looking at the Northbound and Westbound Traffic on Camera 1, and the Southbound and Eastbound Traffic on Camera 2).
I started out trying to implement the first option, but with inconsistent results made worse by spotty network service, it wasn't feasible for this style of live parsing.
The second option didn't seem to make a lot of sense initially, but after observing the views of the cameras, the solution became more clear.